The personal site of Cvet Georgiev

Category: Finance

Does the market know that a recession is coming?

I thought it would be an interesting experiment to see how the market has performed on the cusp of past recessions. Does the market know that a recession is about to happen? Does it behave differently just before a recession? Are there any early indicators of a recession we can deduce?

Lately, there has been a lot of talk about an upcoming US recession, in both the popular media as well as the blogosphere (e.g. see here or here). One major contributor to the rhetoric is the recent inversion between the short and long end of the yield curve. Yield curve inversion has been discussed as a reliable indicator of an upcoming recession.

The experiment

To visually see how the market has moved on a cusp of each recession, I plot the S&P 500 index returns over previous cycles just before a recession. This is not a statistical analysis, but I am curious to see if there any patterns that warrant further statistical study.

What does the data say?

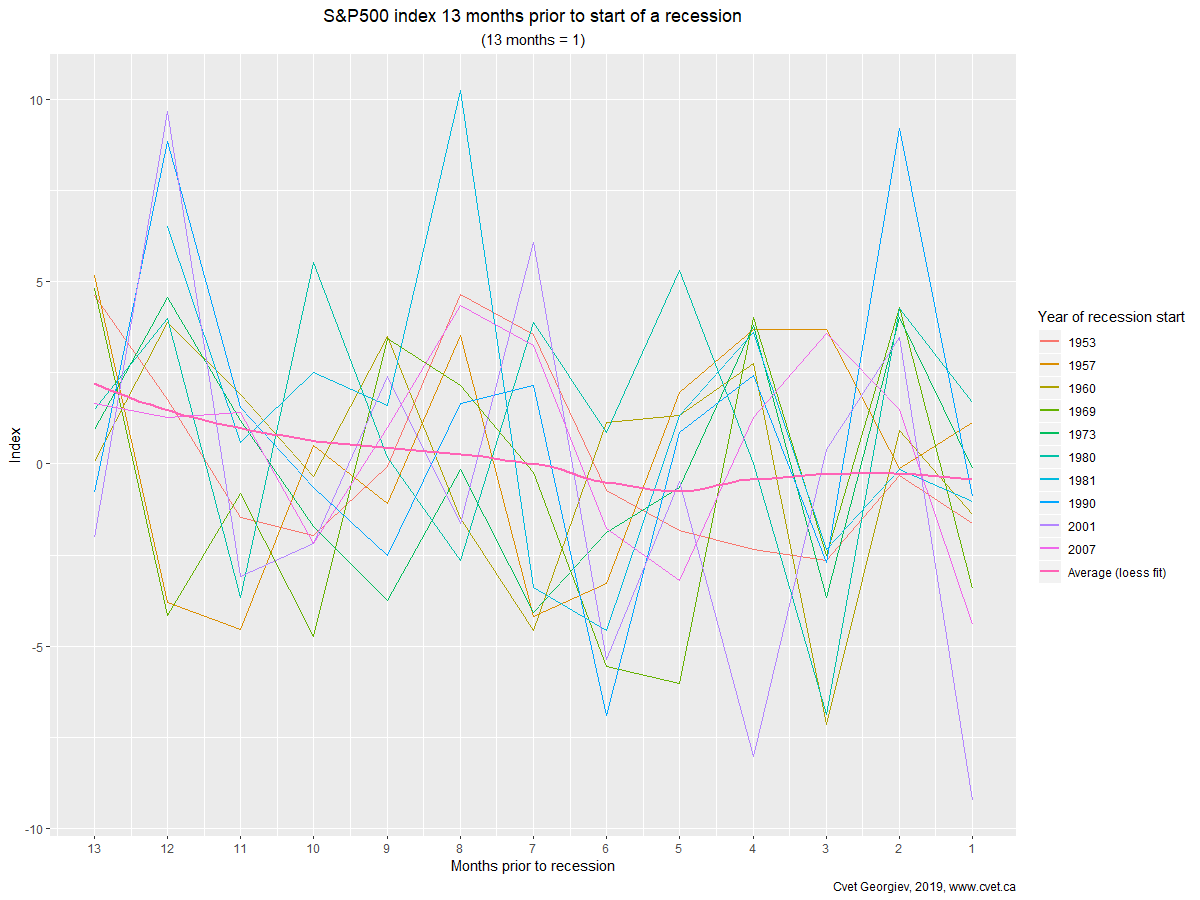
Interestingly enough the data says what I expected it to say. The market has no idea it is about to go into a recession. Looking at the plots of the last 10 recessions, you see that the market is all over the place just before a recession (recession starts at t=0 or the rightmost part of the graph).

Figure 1

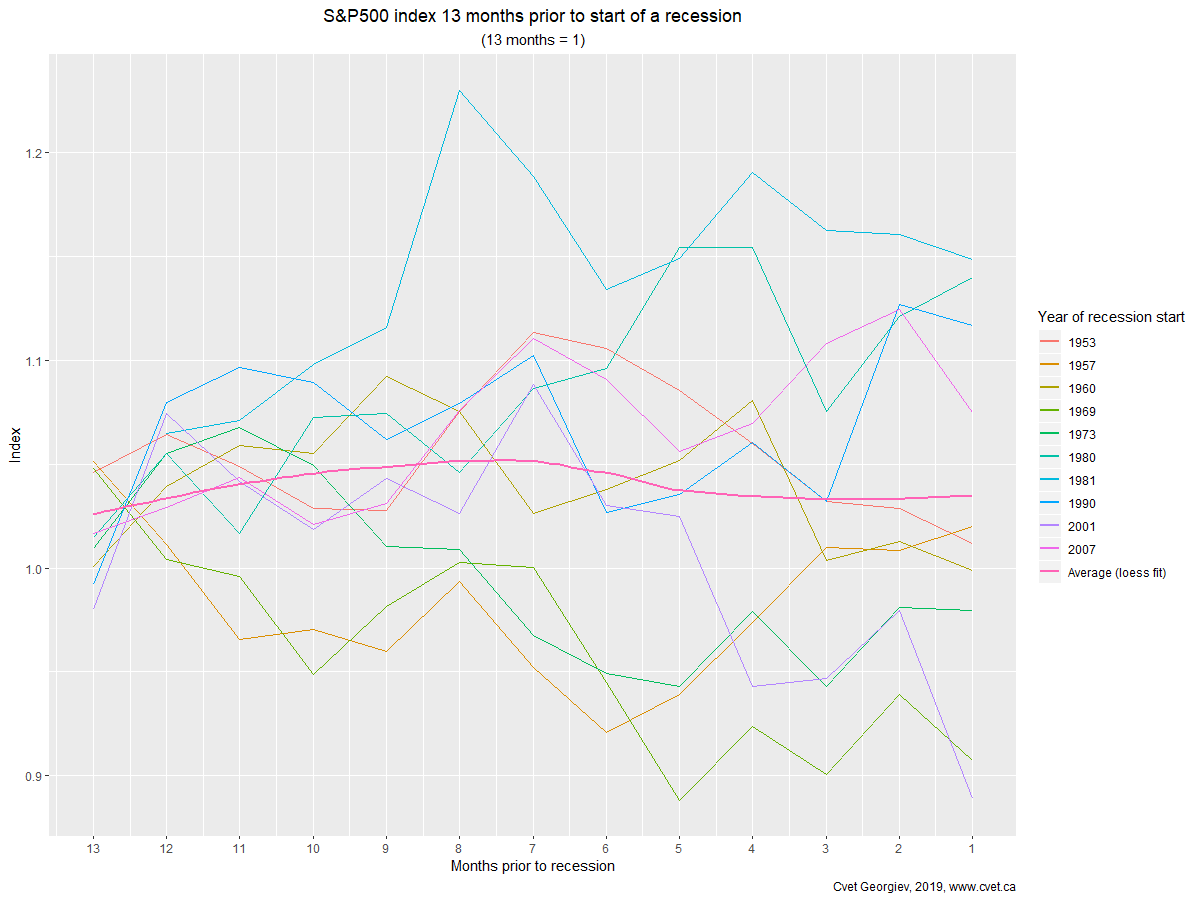
In some years the market is up about 15% up before a recession hits, notably 1981. In others, it is down 10% like in 1969 and 2001 (See Figure 1). There seem to be no discernable patterns you can use to gauge when a recession is coming even from a real-time indicator like the stock market.

Figure 2

Why is the yield curve used as an indicator of a recession?

The reasons given vary but it usually has to do with the normal operation of the financial sector. The main function of most banks is to provide loans to the private sector by borrowing money long-term and lending them short-term while charging a premium. With the inversion of the yield curve, the normal function of the financial sector is being disturbed as banks cannot borrow long-term and lend short since they would have to pay a premium. If this goes for long enough, a recession could originate from the financial sector.

Where does the data come from?

I use the NBER business cycle dating committee as the source of recession start and end dates. Data for “the market” is taken from Yahoo Finance. I use the S&P 500 index as an indicator of the market. It is large enough and covers broad sectors of the US economy that it should more or less represent the general market sentiment. There are better ways to get at the overall market (e.g. combining other US indices – Russell 2000, NASDAQ and Dow Jones) using Principal Component Analysis to get at the common movements across all US markets. For this simple exercise, using the S&P 500 will do the trick.

When is the best time to trade stocks?

If you have studied finance or are listening to the news around the end of the year, the one thing you usually hear about is the January effect in the stock markets. The January effect is the hypothesis that socks increase much more in January than any other month.

Why? One theory is that prices go up because of year-end selling. To defer taxable capital gains to future years, by realizing capital losses in the current year, security holders will sell before the end of the year and then re-buy securities in January. Thus increasing the demand for securities in that month. In practice however, this theory doesn’t hold much mustard because tax rules like the 30-day rule (see the section on the superficial losses discussion here).

Is there such thing as a month effect in the stock market?

If I am writing this blog you probably guessed it that there is such a thing. But it is not the January effect but rather a December effect.

Lets look at the data

I took the last 30 years (1987-2017) of data for the four (4) majour US stock indices (each representing different slices of the stock market):

  • S&P 500 (large-cap stocks)
  • Russell 2000 (small-cap stocks)
  • NASDAQ (mainly technology stocks)
  • Dow Jones (mainly industrial stocks)

I clean up the data and test the statistical significance of the returns in each month and compare them to the distribution of average returns over the preceding 30 years. Because I want to look at what investors get paid for holding risky assets, I use excess return to measure performance. Excess returns are the market return minus the rate paid to hold riskless assets (known as the risk-free rate). For the risk-free rate I used the 3-month Treasury Bill rate.

Results

Based on the results presented in the table below,  I see significantly positive returns in the month of December.  December sees on average about 2% growth in the market as compared to any other month, after accounting for variability of across time. In fact, over the past 30 years, only 6 Decembers have seen a decline in the SP500 index.

Interestingly the Dow seems to be additionally have a pronounced April effect.  I wonder what that could be?

Critique on the t-statistic

For those interested, in the table below I present the statistical results (t-statistic) for all months with significant excess return.  Recent research on the topic of statistical significance in the field of finance has come to the conclusion that t-stats might not be a powerful enough indicator of the significance of the finding. As such, I have published an additional indicator as suggested by  Harvey, Liu, Zhu (2015).  This is a more stringent criterion of significance designed to combat data-mining bias. Harvey et al. suggest using t-statistic bigger than 3.0 as an indicator of significance. Currently most researchers use 2.0. Even with this more stringent criteria December does stand out as a month with significantly positive market returns. Even the Dow April effect passes this more stringent test.

Results for each market are presented in the following tables:

MarketMonth with significant returnProbability of monthly
return >0
T-stat above 3?
(t-stat in brackets)
SP500April98.34%No (2.23)
SP500December99.74%Yes (3.01)
Dow JonesApril99.81%Yes (3.14)
Dow JonesJuly 98.19%No (2.19)
Dow JonesDecember99.80%Yes (3.11)
NASDAQDecember97.55%No (2.05)
Russell 2000December99.99%Yes (4.47)