The personal site of Cvet Georgiev

Category: Visualization

Recession timing in Canada

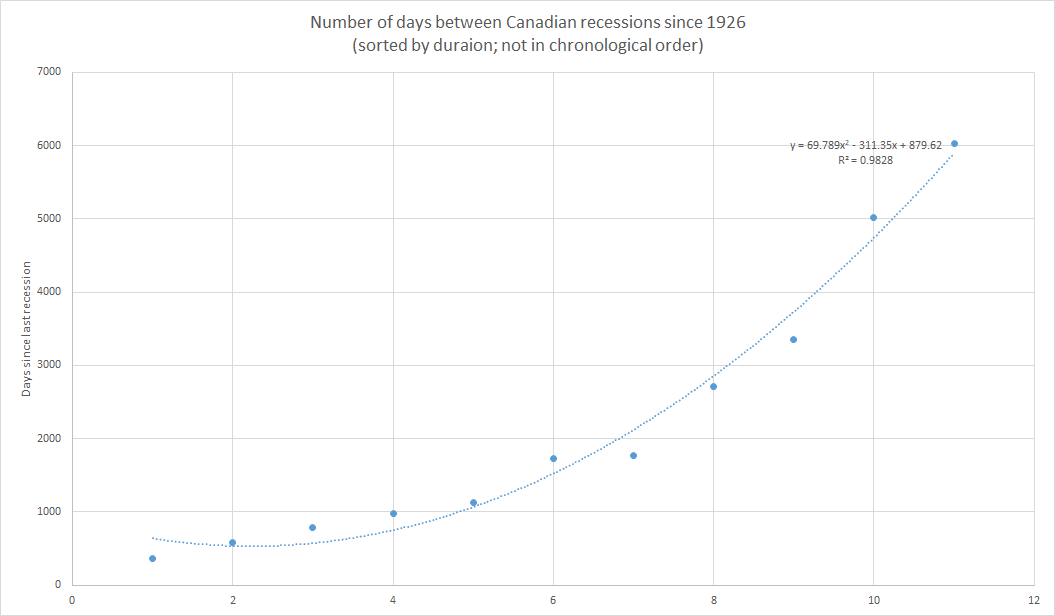
While digging through recession data for Canada I stumbled on this tip-bit: if you sort the number of days between recession dates in ascending order you will find the following quadratic function.

The longest number of days between recessions was 6027 days ( ~16.5 years) while the shortest was 365 days or just 1 year.

On average Canada experiences a recession every 2315 days or 6 years and 4 months (estimated using a non-parametric regression). The last recession ended exactly 3416 days ago. Enough said.

Interactive visualization of Syrian resettlement in Ontario

Have you wondered where Syrian refugees have resettled in Ontario?

The federal government has released data on where Syrian refugees have resettled in Ontario. I have taken that data and made it much more interactive. I find the federal visualization static and not very informative or useful if you wanted to do analysis (for municipal planning for example). I have rebuilt the data to match the lower-tier municipal level structure in the province of Ontario.

The data is updated daily (link to the full-screen map).

Enjoy.

If you have any questions please leave me a comment.

Vizualization example


EDIT: As of January 2, 2017, the Canadian federal government has stopped updating the data so you will not see any further updates to the live map.