The personal site of Cvet Georgiev

Category: Ontario

Open Sourcing Ontario COVID-19 Data

Ontario Ministry of Health has been publishing COVID-19 data for Ontario every day on their website. As far as I know, they have not made it available in a time series format for those of you who like to see the full data since the pandemic began in Ontario. I have been collecting this data and have decided to open source it on my github page. I will continue to collect and publish this data, daily, for those that might find it useful.

Some preliminary findings for Ontario

Unfortunately, preliminary findings show that Ontario is still on the exponential growth path. The straight line in the following graph shows an exponential fit to the data (R-square = 0.98).

Model of best fit for Ontario showing exponential growth of cases (point 22 is March 22, 2020)

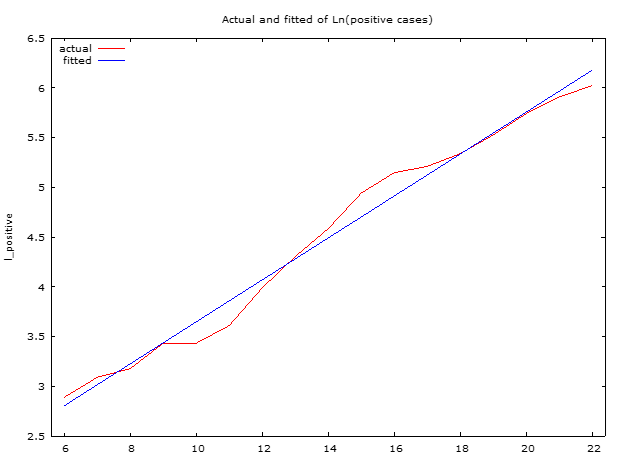
But there is hope. In the last two days, the red line has been shifting from the trend. This could be a break in the exponential growth path (social distancing working) or statistical anomaly. Only time will tell.

Current best model fit for the number of Ontario cases is: $$Number\:of\:positive \: cases= e^{1.54+0.21*Days_{since \: Feb\: 29,\:2020}}$$

Comparison to the Chinese experience

Looking at the Chinese data there is a break in the trend around January 26, 2020. A statistical model of the Chinese data shows this clearly.

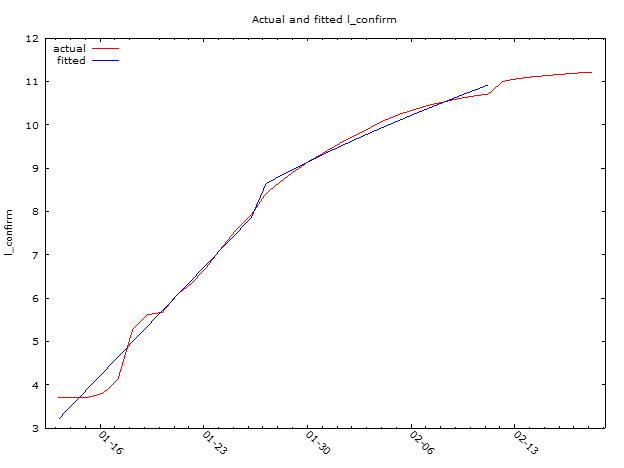
Ontario is still below the point at which the Chinese managed to curb the growth rate of the virus. We are about 11 days away from that event. In our favour is the fact that we are on a less steep path. So we have a bit more time to act and restrain the spread. But we need to do it fast. There is still time to take more action. From what I am observing most of us are doing just that. Bravo but let’s keep this social distancing going.

What explains productivity growth in Ontario?

Last year, I wrote and presented a paper at the Canadian Transportation Research Forum that expanded the official productivity statistics for Ontario from 1997 back to 1985.

The method I developed increased the sample size of productivity statistics for Ontario by an additional 12 years (essentially doubling the sample). The surprising result is that productivity slowdowns, such as the one we have been experiencing recently, are the norm according to the history of productivity statistics. Looking back to the period 1985 to 1993, I see a significant stagnation in the growth rate of productivity, similar in magnitude to the decline since 2008. It is the nature of productivity growth to be unpredictable. Therefore, it is highly likely that the recent productivity slump does not represent a profound shift in the underlying dynamics of the discovery of new ideas or human technological progress.

If you would like to read the full paper, you can download it from here: Canadian Transportation Research Forum

Figure 1: Index of Ontario’s Productivity growth between 1985 and 2010. Ontario's productivity index

Where does it pay to live in Ontario?

Recently, I have been looking through some wage data, and I found one fascinating fact about the difference in wage rates between different skill categories (from skilled to unskilled).  In Ontario, the difference in wage rates (weighted by the available jobs) between large metropolitan cities (Toronto) and smaller towns (Windsor-Sarnia, Ontario) is minimal for the most unskilled jobs. There is a premium for working in large metropolitan cities for most jobs, but the % difference is quite small (less than 5%).  In smaller towns, there exists a significant disincentive for skilled labour to attend to. In this example, Windsor-Sarnia has a 12% lower wage rates for similar work in other places in Ontario.

Why is this important? It pays for low skilled labour to live in smaller cities in Ontario as the difference in wages would be non-existent while the cost of housing is much lower. Paying less rent while receiving almost identical income as compared to a big city like Toronto is quite the incentive.

The opposite is true for skilled labour. The premium is not as much as I would have expected given the magnitude of Toronto economic region (ER) compared to the next closest economic region (Toronto ER is about five times bigger than the next closest one Kitchener-Waterloo-Barrie).

Here is the summary table of the finding:

Wage difference (%) from Ontario’s average
Skill level Toronto Windsor-Sarnia
Skilled (A) 3% -12%
Less skilled (B) 5% -4%
Almost unskilled (C) 0% 0%
Unskilled (D) 3% 0%

Actual wage rates see below:

Average wage rates (weighted by the # of available jobs)
Skill level Ontario (average) Toronto Windsor-Sarnia
Skill levels A  $  32.79  $  33.77  $ 28.69
Skill levels B  $  19.72  $  20.63  $ 18.94
Skill levels C  $  14.51  $  14.46  $14.50
Skill levels D  $  12.37  $  12.74  $12.33
All skill levels  $19.07  $20.77  $16.74

Source: Statistics Canada. Table 285-0003 – Job Vacancy and Wage Survey (JVWS), Q2-2016.

Notes:

(1) Toronto defined as Toronto Economic Region by Statistics Canada in the Economic Regions – Variant of SGC 2011.

(2) Windsor-Sarnia defined as Windsor-Sarnia Economic Region in the Economic Regions – Variant of SGC 2011.

(3) All occupations within a skill category have been weighted by the number of job vacancies to account for the difference in demand and supply conditions in each occupation type.

Interactive visualization of Syrian resettlement in Ontario

Have you wondered where Syrian refugees have resettled in Ontario?

The federal government has released data on where Syrian refugees have resettled in Ontario. I have taken that data and made it much more interactive. I find the federal visualization static and not very informative or useful if you wanted to do analysis (for municipal planning for example). I have rebuilt the data to match the lower-tier municipal level structure in the province of Ontario.

The data is updated daily (link to the full-screen map).

Enjoy.

If you have any questions please leave me a comment.

Vizualization example


EDIT: As of January 2, 2017, the Canadian federal government has stopped updating the data so you will not see any further updates to the live map.